
Your spreadsheet already has the data, but turning it into a dashboard people can actually use still takes too much manual work.
The numbers may be there, but every update means rebuilding charts, reformatting views, sharing a file that exposes too much information, and managing workflows through tabs and formulas that were never designed to function as real business processes.
That’s the gap many teams run into with Google Sheets and Excel. The spreadsheet becomes the operational system, but not the application layer around it.
OptiDev is built for exactly this.
It connects to your existing spreadsheet as a live data source and generates a proper dashboard, reporting portal, or operational tool without forcing you to migrate the data or change how your team works.
Describe what you want to build. OptiDev handles the code and deployment.
What's actually holding you back
Google Sheets and Microsoft Excel are excellent for storing and updating business data. That’s why so many teams, such as sales teams and operations teams, rely on them for sales data, inventory management, customer data, internal reporting, etc.
The problem starts when spreadsheets become customer-facing, executive-facing, or team-facing systems.
Charts are functional, but they are not presentation-ready. Making them look clean and keeping them updated still takes manual work.
Sharing is another problem. Send someone the file link, and they often see more than they need: every tab, every column, and every raw row of data. That creates friction for team members who only need a focused view, and it creates risk when the file includes sensitive sales data or customer data.
Then there is workflow management. Teams end up building processes around spreadsheets that were never designed to function like real applications:
manually updated reports
copied charts for meetings
multiple spreadsheet versions
disconnected tools
difficult permissions management
no proper frontend experience
The data is usually fine. The problem is everything around it: the reporting effort, the chart maintenance, the sharing limitations, and the fact that spreadsheets were never designed to be a polished user interface. That is exactly the gap OptiDev is designed to close.
Keep the spreadsheet. Upgrade the interface.
The better approach is not replacing the spreadsheet entirely. It is keeping the spreadsheet as the source of truth while connecting it to a tool that turns it into a real business application.
The spreadsheet stays in place while OptiDev turns it into dashboards, reporting portals, operational tools, and internal business applications. The team continues updating the spreadsheet normally, and the application reflects those changes automatically.
A real example: from sales tracker to live dashboard
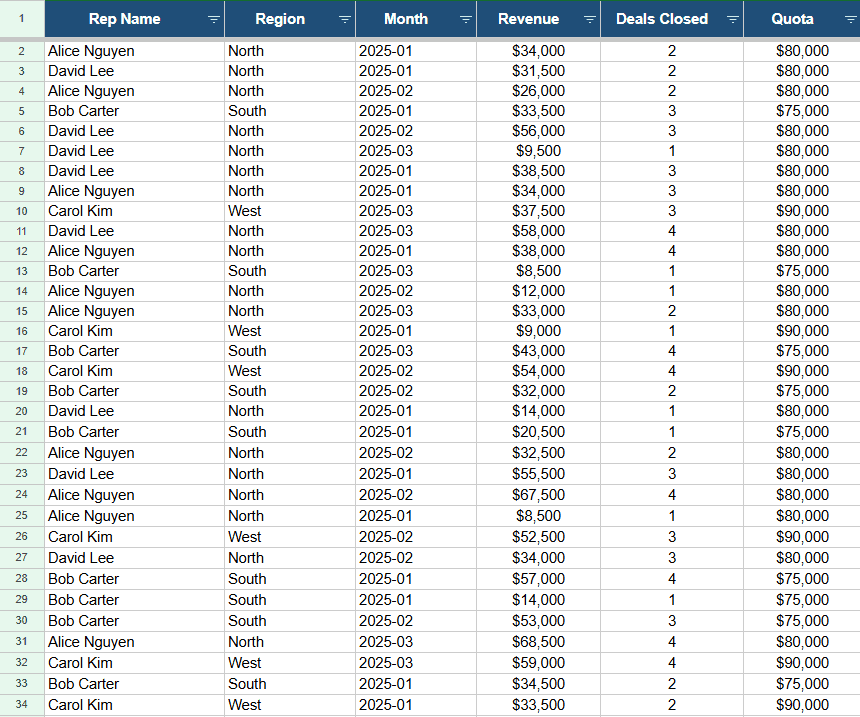
A good example is a standard sales tracker in Google Sheets that was turned into a live dashboard with OptiDev.
The spreadsheet already contained the operational data used for sales reporting, so instead of manually rebuilding reports each week, the process started with a simple prompt in plain English.
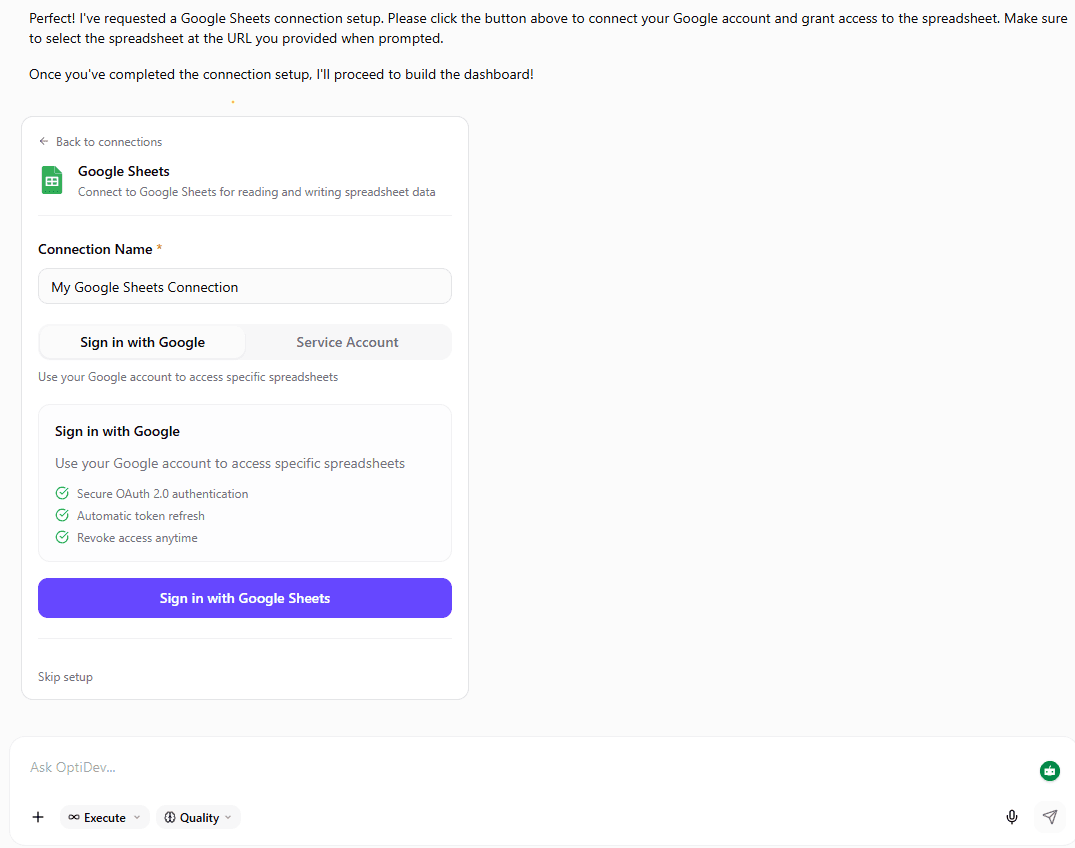
Prompt: “Build a sales performance dashboard connected to my Google Sheet.”
From there, OptiDev connected to the Google Sheet via OAuth. The file stayed private in Google Drive, and the spreadsheet remained the source of truth throughout the process.
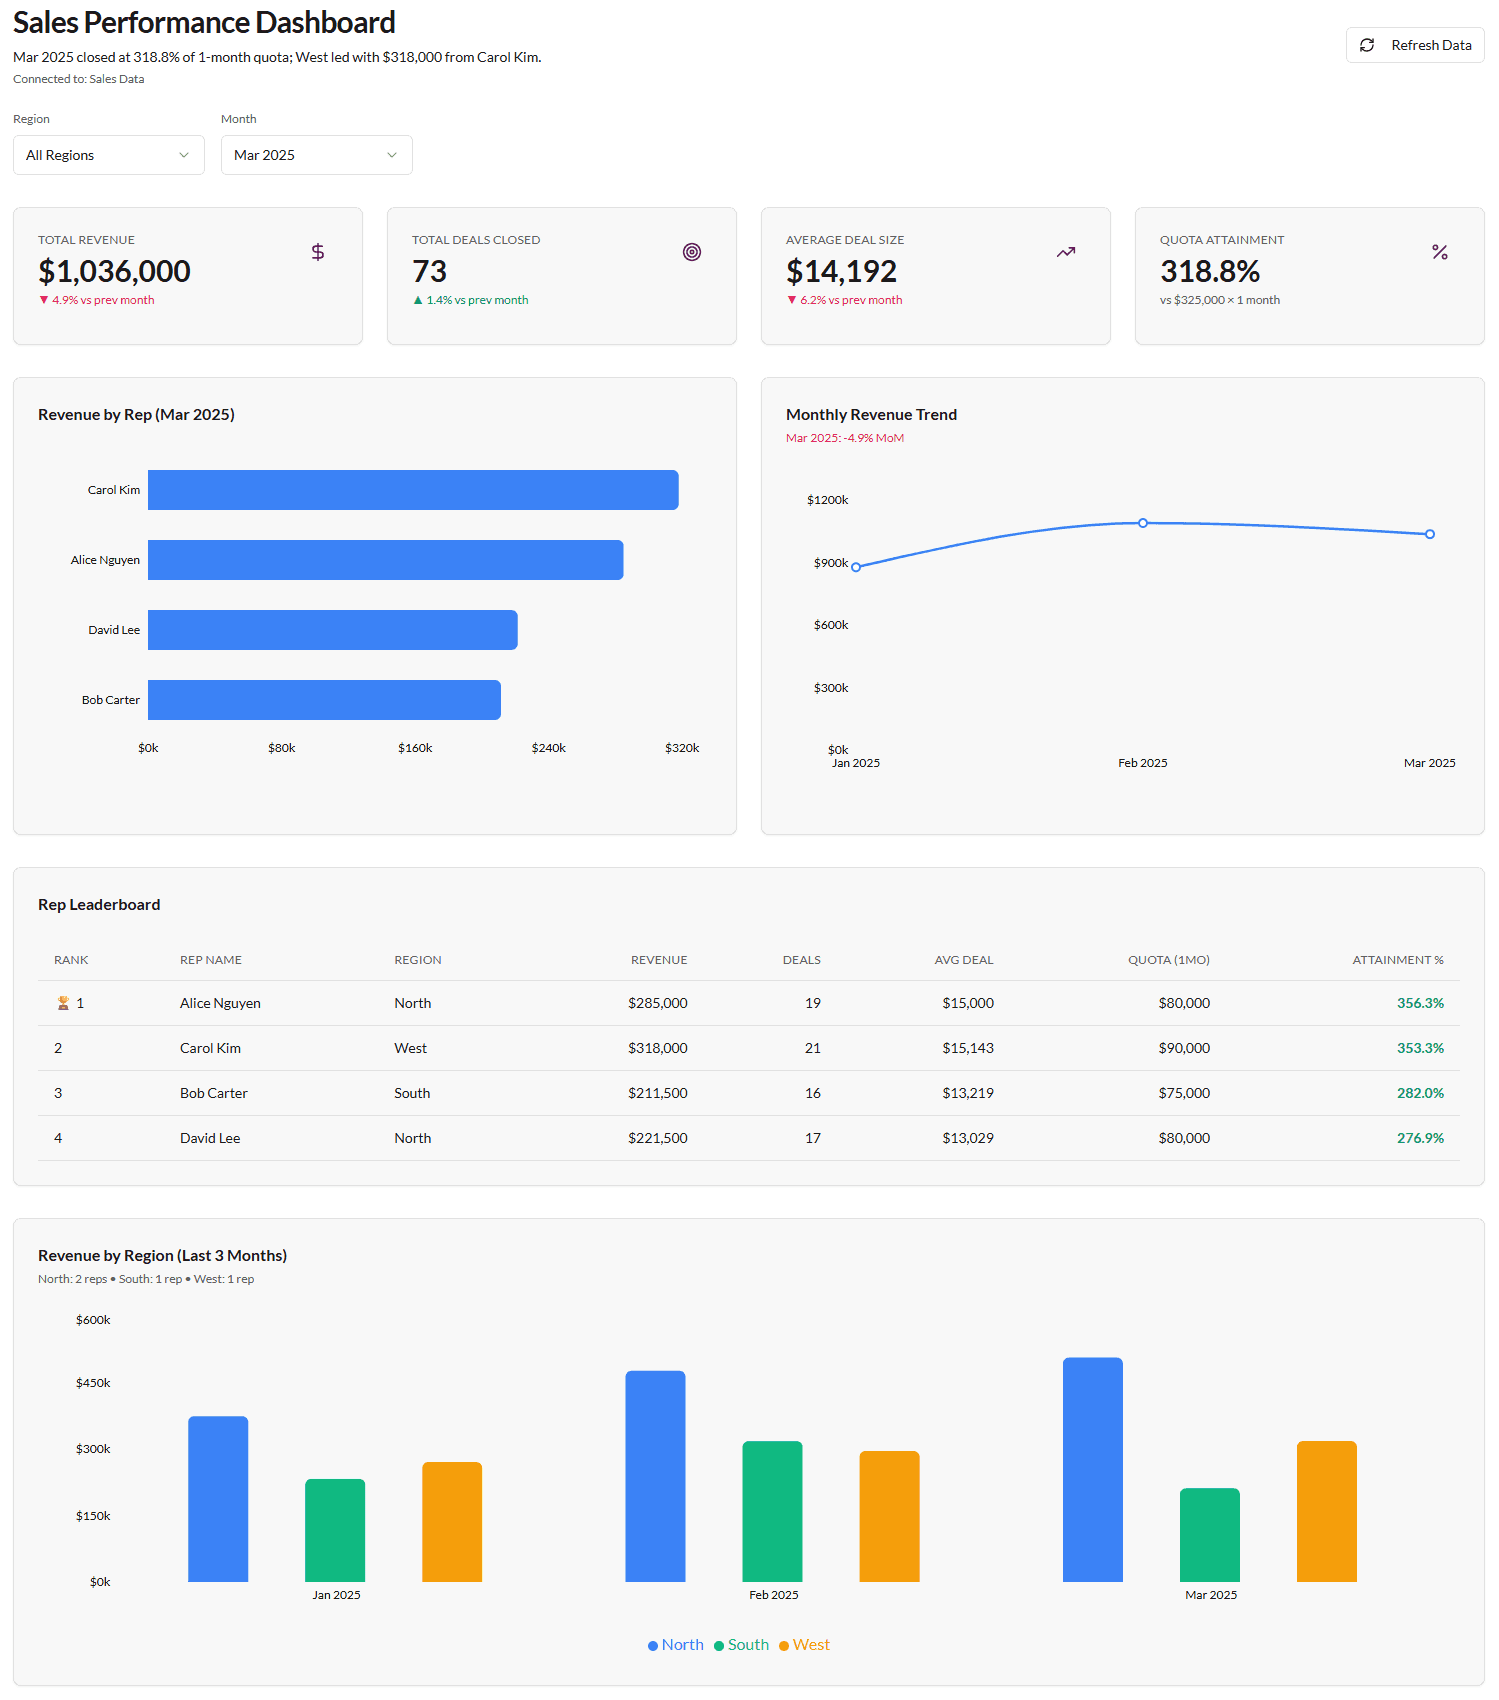
Once the connection was ready, the dashboard was described in simple language: KPI cards at the top, a few key charts, a leaderboard, basic filters, and a clean layout suitable for leadership. OptiDev then turned that description into the first version of the dashboard, which was refined with a few small adjustments afterward.
After a few refinements, the dashboard was ready to publish. The result was a live URL that was immediately shareable. When the data in the sheet changes, the dashboard can pull in the latest version.
What stood out
A few things stood out in this real-world example.
It started with a plain-language prompt. There was no code to write, no templates to fill in, no schema to configure, and no drag-and-drop component setup. The AI-powered workflow translated a simple description into a working dashboard plan, while the spreadsheet itself stayed where it was. The existing workflow remained intact, and OptiDev generated the interface around it.
The dashboard can be shared without sharing the spreadsheet. The dashboard became a cleaner business interface with proper filtering, reporting views, and better access control. Instead of handing someone a raw spreadsheet, you can give them a focused dashboard built for meetings, review, and decision-making.
What you end up with
Before: a spreadsheet that holds the data but can't present it. Charts that need rebuilding every cycle. A shared link that gives too much access. A layout that doesn't hold up on a screen.
After: a live dashboard with proper charts, cleaner sharing, and a shareable URL. The spreadsheet didn't go anywhere. It just got a real front end.
Not a prototype. Not a slide deck rebuilt every week. A dashboard that updates when your data does and looks like something you would actually want to put in front of an executive.
Start with the spreadsheet you already have
If your team already has the data in a spreadsheet, the next step may not be rebuilding the whole process. It may just be giving that data a better way to be seen, shared, and used.